Intensity.
Isodynamic chart

Inclination
Isoclinic chart
Declination
Isogonic chart
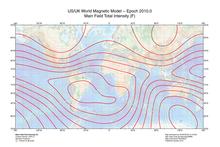
| 47.000 nT | Main Field Total Intensity |
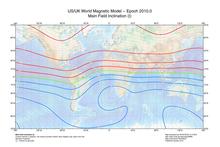
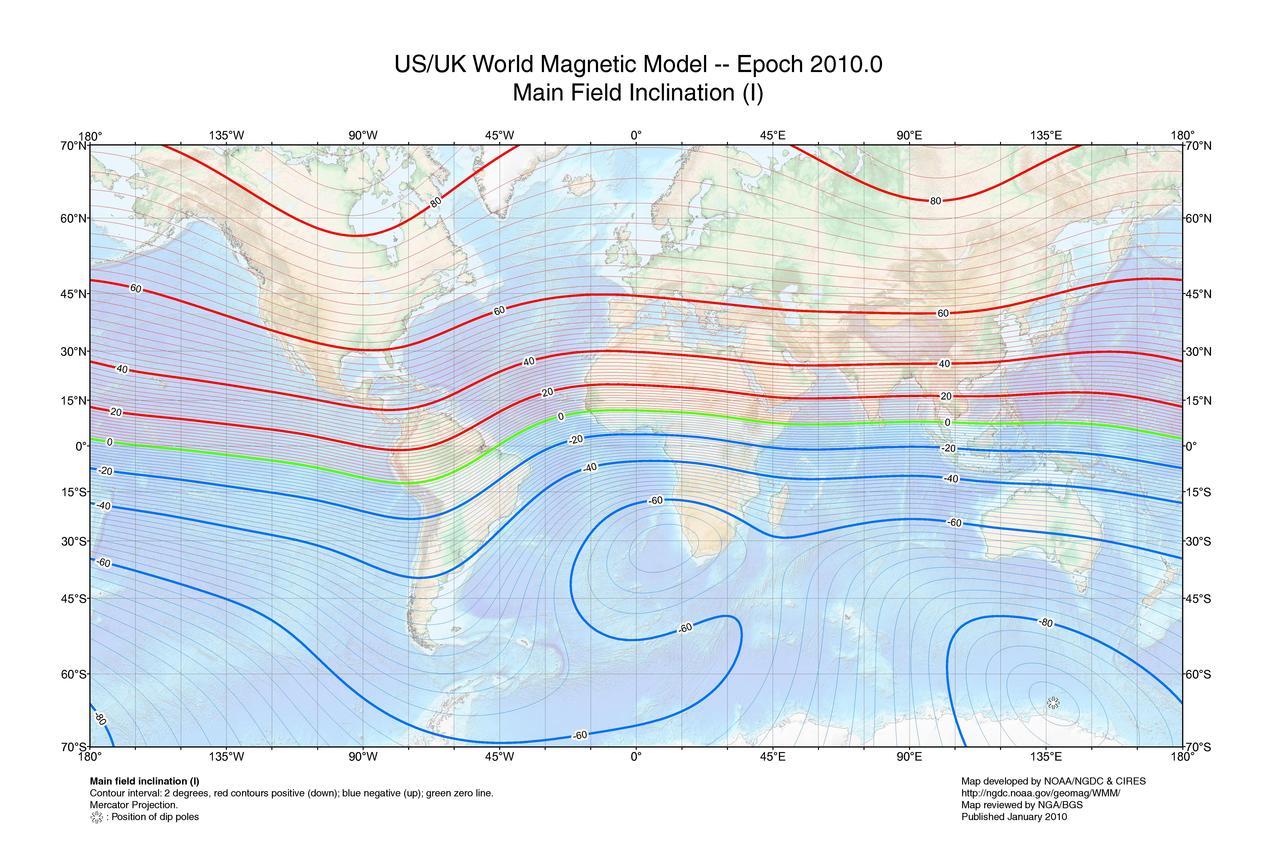
| 60° | Main Field Inclination |
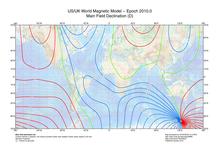
| 2° | Main Field Declination |
La Rete Magnetica Italiana e la Carta Magnetica d'Italia https://www.igmi.org/carta_magnetica_2020/
Intensity.
|
Inclination
|
Declination
|
The inclination is given by an angle that can assume values between -90° (up)
to 90° (down). In the northern hemisphere, the field points down. It is straight
down at the North Magnetic Pole and rotates upwards as the latitude decreases
until it is horizontal (0°) at the magnetic equator. It continues to rotate
upwards until it is straight up at the South Magnetic Pole. Inclination can be
measured with a dip circle.
An isoclinic chart (map of inclination contours) for the Earth's magnetic field
is shown on the right.
| Intensity.
Isodynamic chart |
Inclination Isoclinic chart |
Declination Isogonic chart
|
Intensity |
||
|
|
The intensity of the field is greatest near the poles and weaker
near the Equator. It is generally reported in nanoteslas (nT) or gauss,
with 1 gauss = 100,000 nT. It ranges from about 25,000–65,000 nT, or
0.25–0.65 gauss. By comparison, a strong refrigerator magnet has a field
of about 100 gauss. A map of intensity contours is called an isodynamic chart. A minimum intensity occurs over South America while there are maxima over northern Canada, Siberia, and the coast of Antarctica south of Australia. |
|
Inclination |
||
 |
The inclination is given by an angle that can assume values
between -90° (up) to 90° (down). In the northern hemisphere, the field
points down. It is straight down at the North Magnetic Pole and rotates
upwards as the latitude decreases until it is horizontal (0°) at the
magnetic equator. It continues to rotate upwards until it is straight up
at the South Magnetic Pole. Inclination can be measured with a dip
circle. |
|
Declination. Isogonic chart (map of declination contours) |
||
|
|
Isogonic lines give the declination in signed degrees. Declination is positive for an eastward deviation of the field relative to true north. It can be estimated by comparing the magnetic north/south heading on a compass with the direction of a celestial pole. Maps typically include information on the declination as an angle or a small diagram showing the relationship between magnetic north and true north. Information on declination for a region can be represented by a chart with isogonic lines (contour lines with each line representing a fixed declination). | |